


Our Approach: Aerodynamics
Aero is often seen as the holy grail of cycling: aerodynamic performance influences everything from clothing to components to positioning, and of course the design of the bike itself. What are the main principles of aerodynamics, and how do we address them in our bike design?
Aero Drag: the Basics
There are four major contributors to rider displacement: air resistance, altitude gain resistance, acceleration resistance and mechanical loss. The ratio of the contribution of these four forces changes based on riding conditions. Altitude gain resistance increases as the grade of a climb increases, for example, and air resistance decreases on that same climb as the rider slows down.
In general, the bike itself accounts for about 20% of aero drag, across all conditions, and the rider accounts for the other 80%. The design of a bike focuses on both of these parameters, as geometry and component design affect rider positioning. At Argon 18, while we do focus on the aero properties of the bike frame itself, we are known to have one of the widest fit windows in the industry, so that all riders can achieve their optimal aero position.
There are two parameters we can address to improve the aerodynamic performance of an object: its shape and its frontal area. We can see the effects of adjustments to both of these parameters by measuring the CdA, or drag coefficient. The drag load applied to rider and bike is usually represented with following formula:
F= 1/2ρ.v2 × Cd × A
Where:
1/2ρ.v2= Environment (air density and air flow speed)
Cd = Shape (drag coefficient)
A = Size (frontal area)
We use CdA as a measure because it is relatively constant with air flow velocity, therefore provides a valid comparison between objects and between tests. We use three major forms of testing in our design process: Computational Fluid Dynamics, wind tunnel tests, and real-world testing with Notio.
CFD Analysis
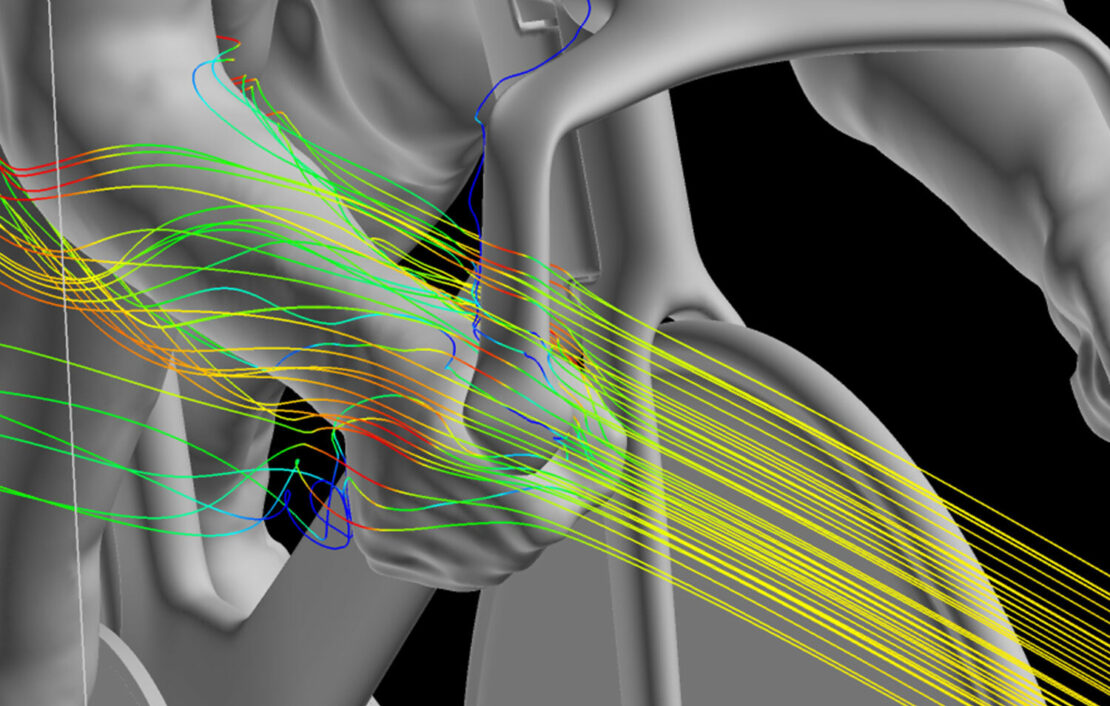
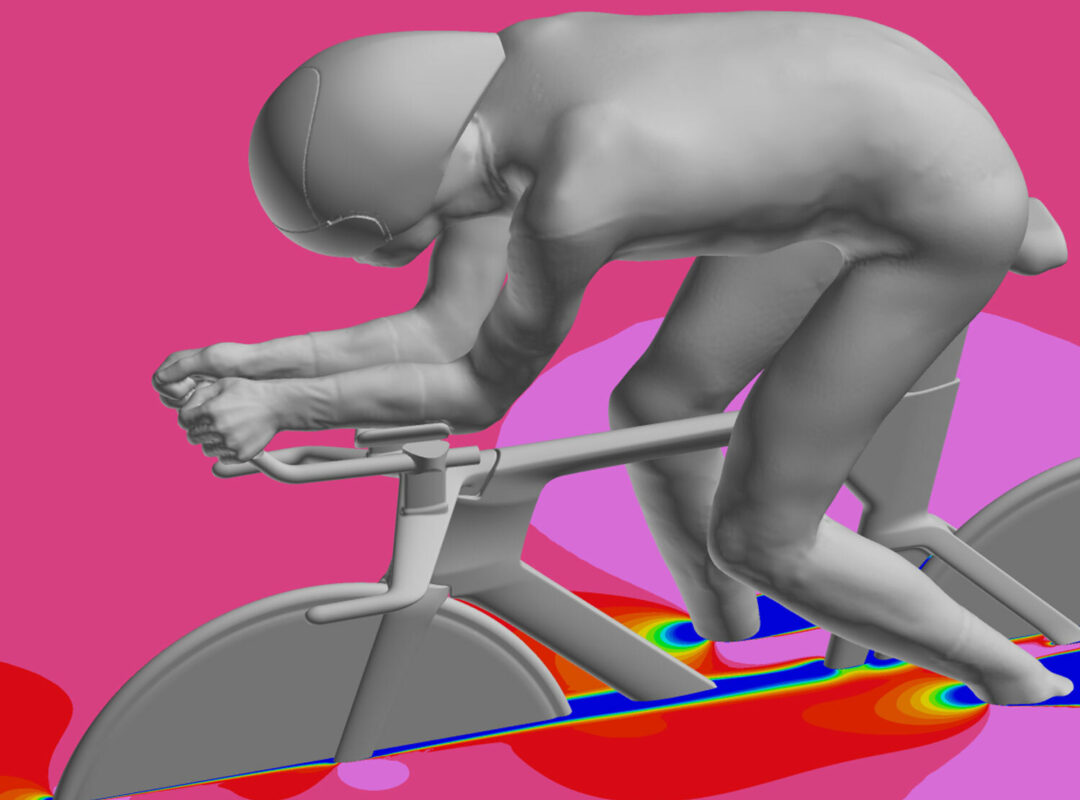
Computational Fluid Dynamics (CFD) is a numerical simulation tool to predict aerodynamic performance. You’ve probably heard of CFD being referred to as a “virtual wind tunnel”, but both CFD and the wind tunnel have their own unique role in the development process. In relation to testing bikes, the ‘fluid’ in Computational Fluid Dynamics is air – which is why the images that result from CFD analysis look as through the bike is moving through a fluid. In CFD, we can see how the flow behaves around rider and bike frame.
To run the analysis, the fluid volume studied around the rider is divided into cells, which form a mesh over the entire surface of the object. Fluid behaviour is calculated for each cell of the volume, and the load applied by air to the rider is calculated at each point of the rider mesh, allowing us to estimate the bike and rider drag force. We have developed a specific meshing strategy that allows accurate results with reasonable calculation time.
This analysis can lead to design changes that improve the flow around fork and frame shapes. The interaction with the rider’s body is also taken into account, since most of our CFD analyses include also simulating a rider in the analysis.
One CFD run can require up to 60 million mesh cells, with up to 100 calculation steps, and take up to 12 hours to calculate one result (one configuration / one yaw / one wind velocity). While that sounds very time-consuming, in fact this process saves time because it gives us a very clear understanding of the aero properties of a frame before moving into the prototype phase. CFD allows us to evaluate dozens of iterations in a much shorter timeframe than going to the wind tunnel with prototypes.
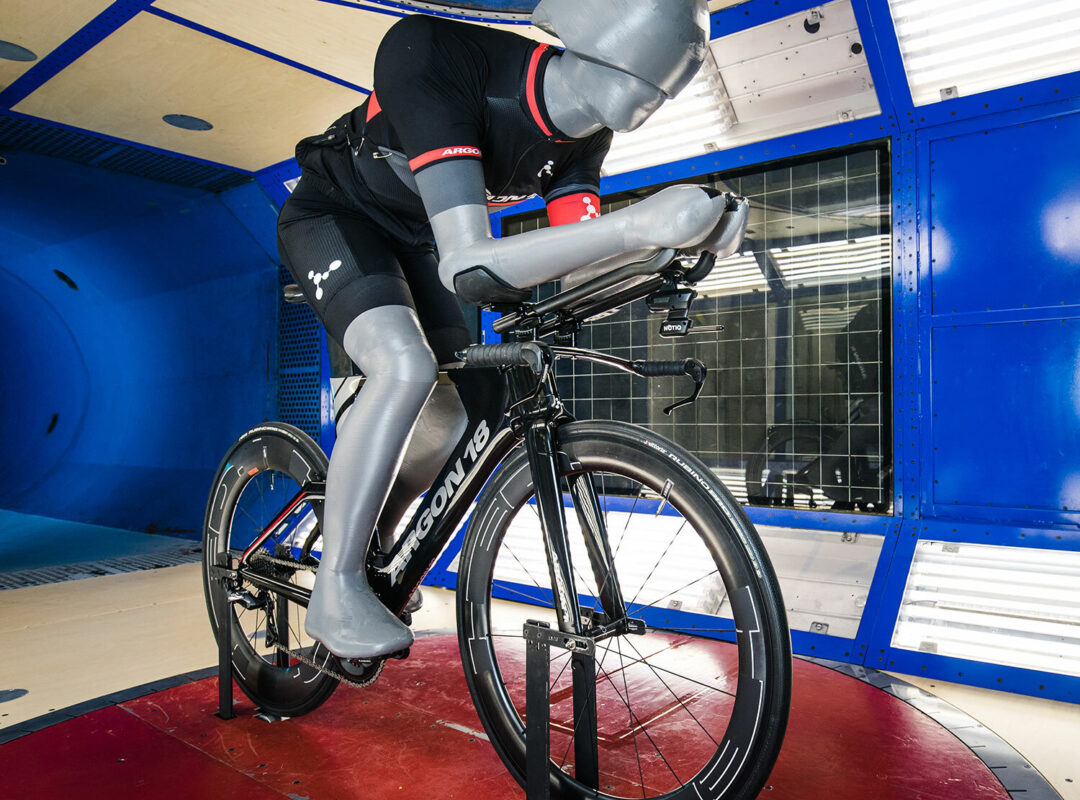
Testing in the Wind Tunnel
CFD, as most simulation methods, does not replace real-world tests. That is why wind tunnel tests are frequently used to validate what we see in CFD. In the wind tunnel a controlled air flow with known velocity is applied to the rider. Load sensors are used to measure the force applied by the air on the rider.
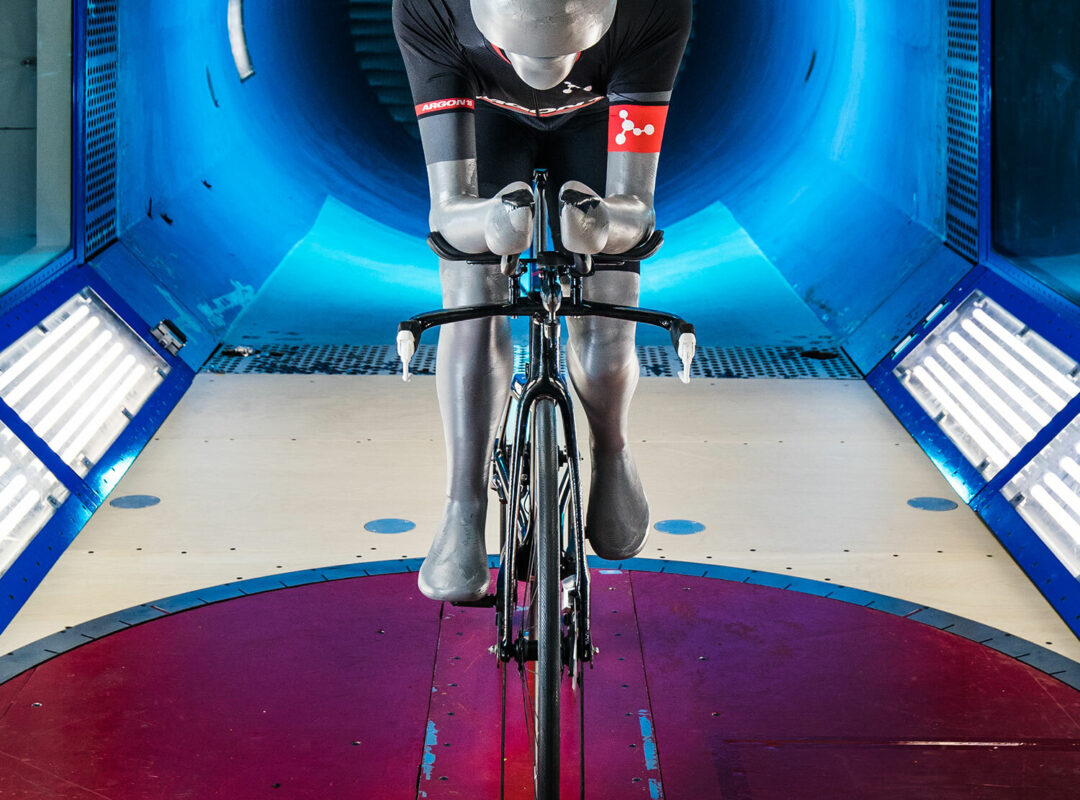
In the real world, of course, wind comes at riders from all different angles, not just straight ahead. In the wind tunnel we do not have actual sidewinds, so we rotate the bike on a pedestal to achieve test results at precise yaw angles. But what do we actually mean by yaw? Yaw is the angle of the effective wind speed relative to the forward-moving speed of the bike and rider. For example, zero-degree yaw is when a bike is moving straight into a headwind. With a sidewind, we calculate the vector that the wind speed hits the rider, when we account for the forward motion of the rider. For example, if the wind is hitting the rider from the side (perpendicular to rider moving direction) at 5km/h, and the rider is moving forward at 40km/h, the flow is hitting the rider with a 7° yaw angle.
It is important to measure the CdA of an object at yaw angles that represent its intended use. The most common yaw angles seen in real-world cycling are between 10 and -10 degrees, therefore we put more emphasis on the results between these yaw angles. To do so, CFD or wind tunnel test data are weighted to give more value to results which are more likely to occur when we calculate the average CdA value.
A real rider can be used during wind tunnel tests, however, it is difficult for a real person to keep exactly the same position between several tests. This means we would introduce variability, which makes small variations coming from frame very difficult to evaluate. We prefer using a rider mannequin in our wind tunnel testing. Our mannequin was produced over 13 days of continuous 3D printing at our Montreal office in 11 parts, using a total of 17.5 kg of plastic. A bike’s performance without a rider may produce interesting test results, but these results are not really relevant in a race situation. For example, if we optimize the airflow around the basebar and extensions without taking into account that the rider’s position changes the airflow in this area, we haven’t produced a valid result that can help us improve our bike design, and therefore help improve our riders’ performance.
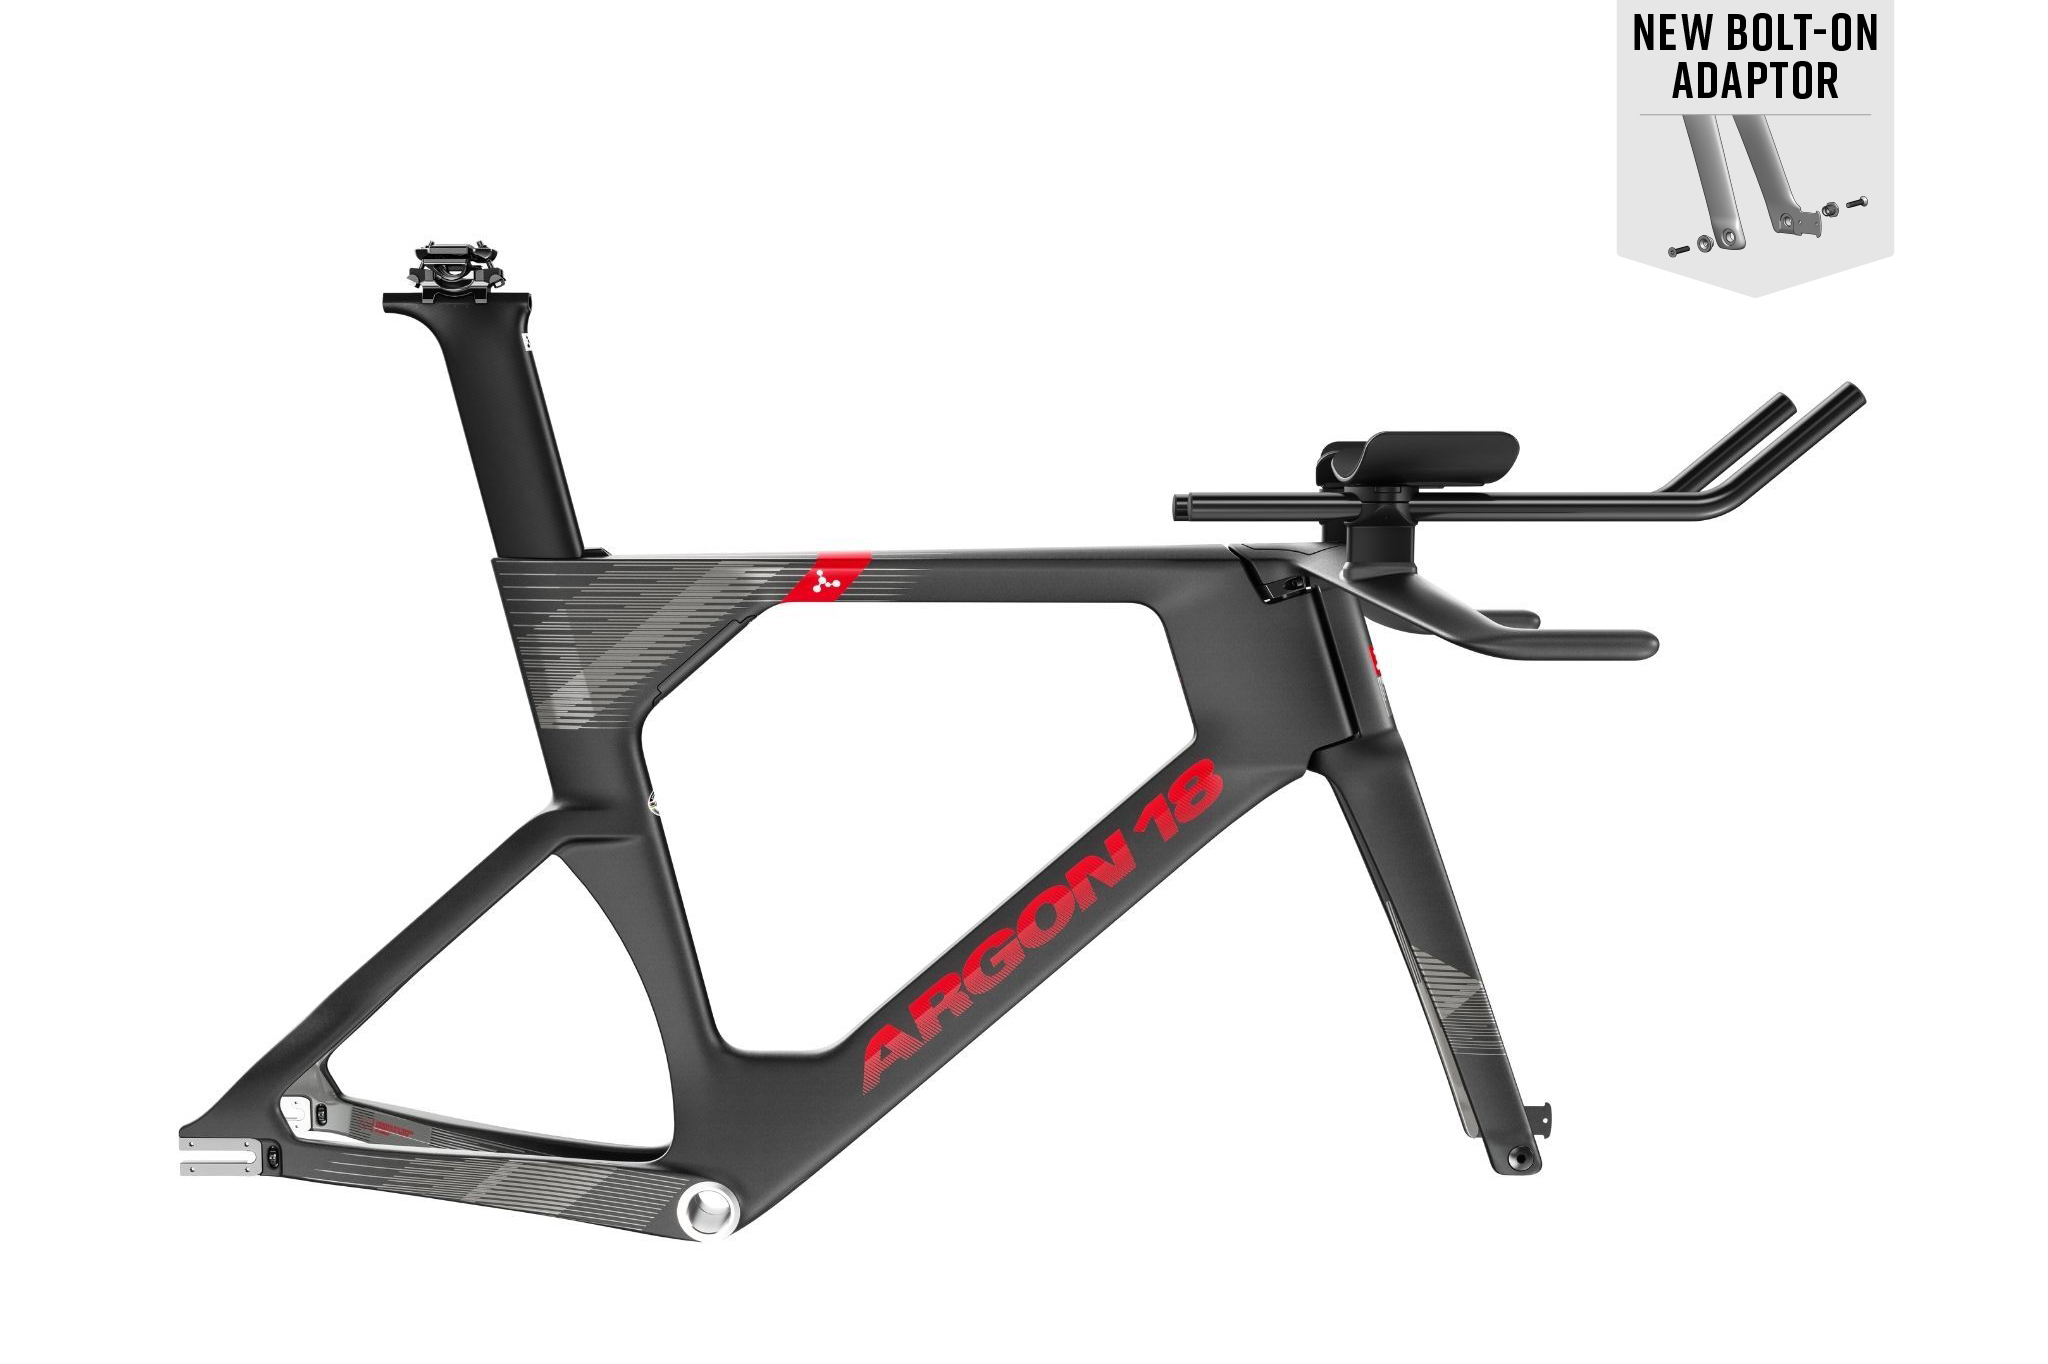
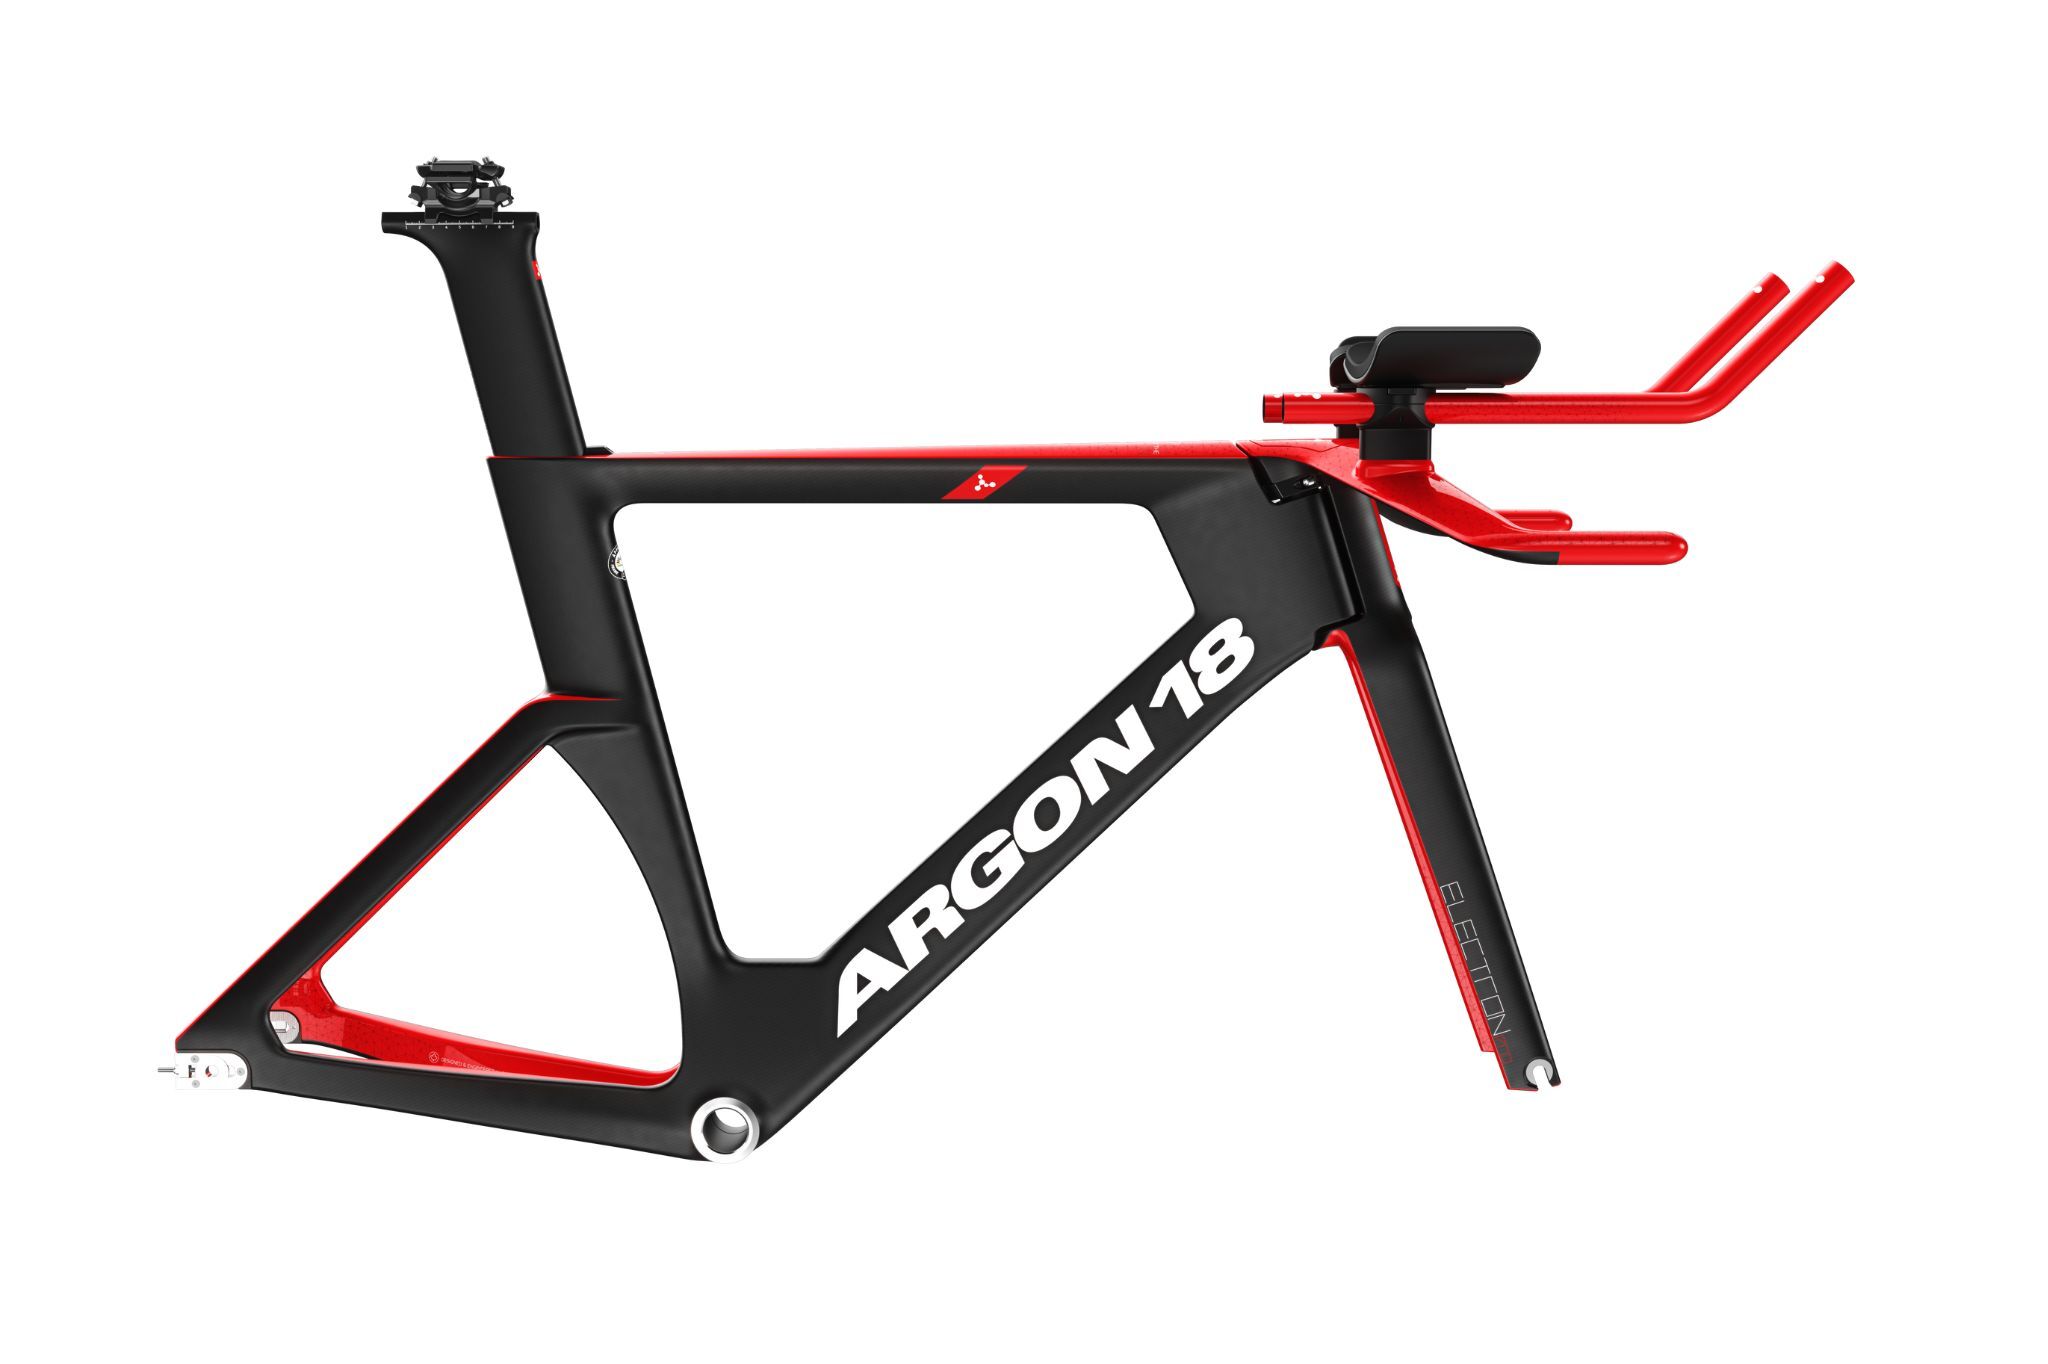
These simulation and testing protocols have direct impact on our design process, and you can see the results on our bikes. The E-118 Tri+, for example, has very different tube shapes along the fork legs as compared to the previous-generation E-118 Tri Next. The new shape was optimized in CFD to obtain the best aero performance while respecting UCI rules. The sprint fork on the 2020 Electron Pro was also informed by this same protocol. The Electron Pro’s revolutionarily slender pursuit fork is a great example of design based on aero data – in CFD we could see that the closely-placed fork leg was ‘hidden’ by the wheel, and this finding was confirmed in the wind tunnel. Similarly, we saw in CFD that the triangle between the top tube and seat tube improved aero performance, but we were initially skeptical because this doesn’t account of the movement of the rider’s legs, which is key in this region. However, we then tested with a moving mannequin in the wind tunnel, and confirmed the result.
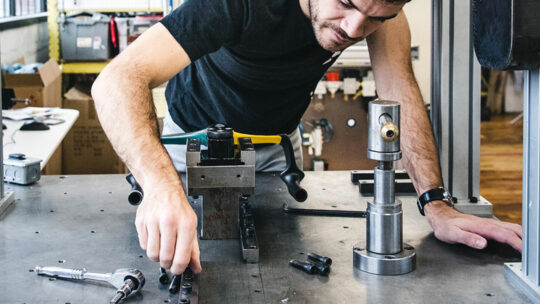
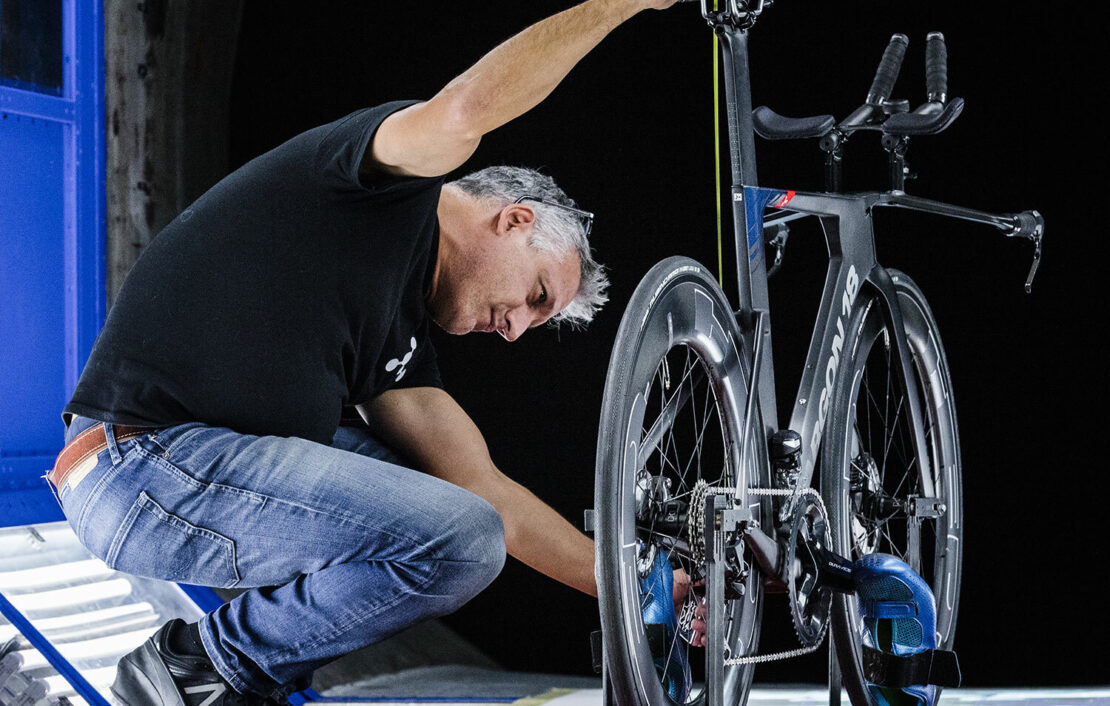 PHOTO: François Maisonneuve
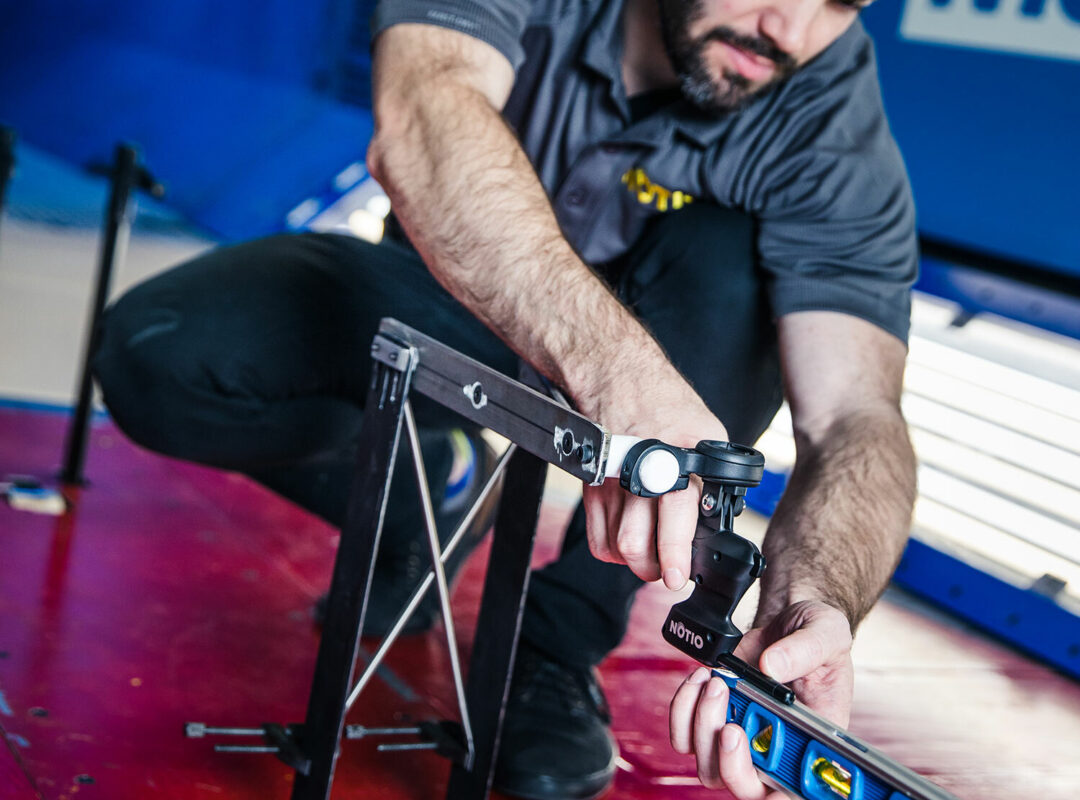
Real World Testing: Notio
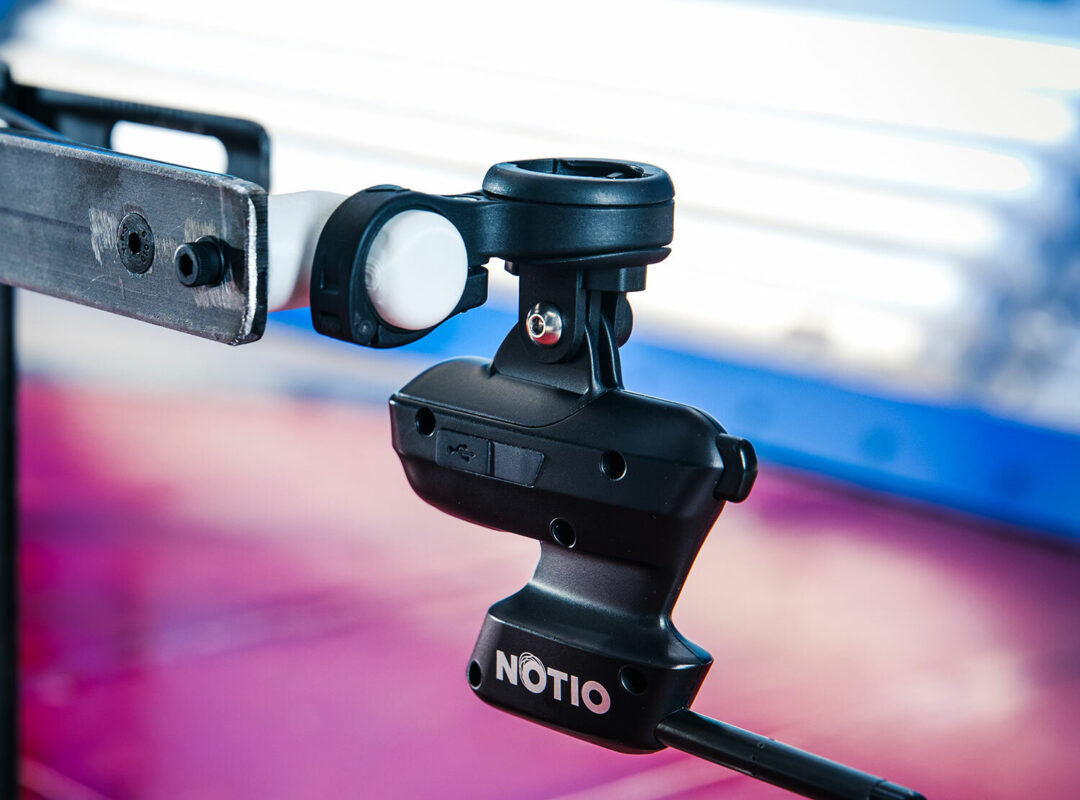
At Argon 18 we also use the Notio device, developed in our in-house innovation lab. Mounted on the bike, Notio calculates CdA in real time from data gathered by several on-board sensors: GPS, speed sensor, accelerometer, pitot stick, and powermeter. Calculations using this data allow us to isolate CdA.
Of course, Notio and other real-world testing can only be done at a significantly advanced stage of development. In contrast to CFD, which allows us to quickly produce new design iterations, and the wind tunnel where we can test early prototypes, we must have a ridable production frame to test with Notio!
We did extensive Notio testing with the E-118 Tri+, which allowed us to directly validate the aero performance in comparison to older models, such as the E-118 Tri Next, while also gathering athlete feedback on the performance of the bike.
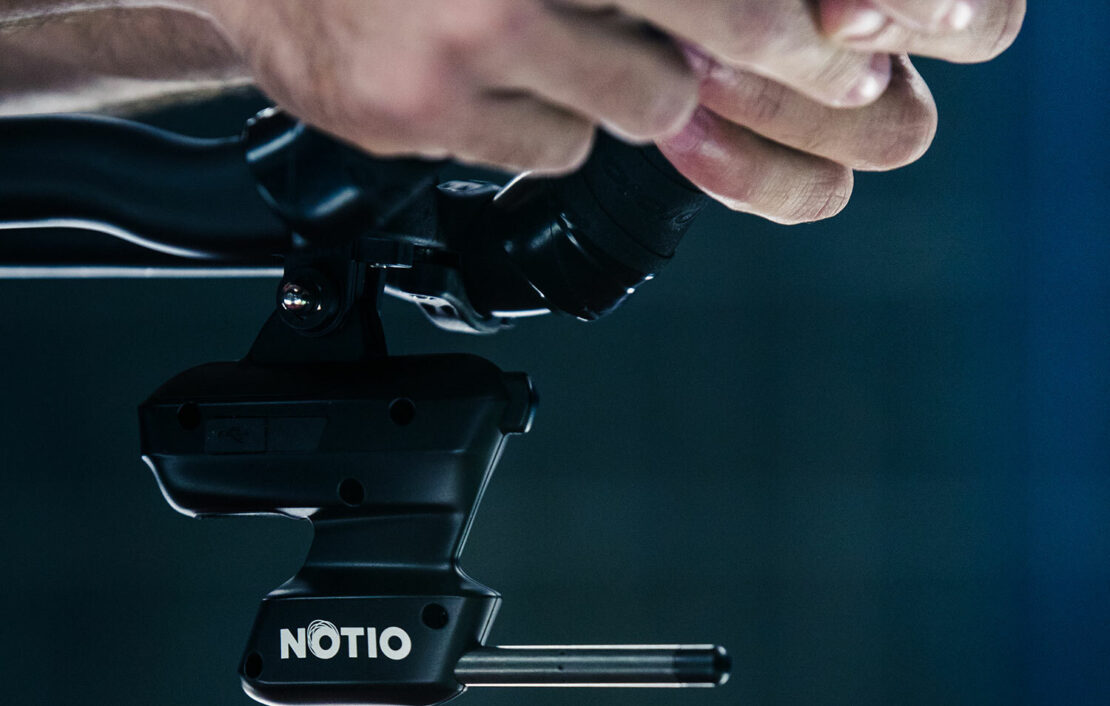 PHOTO: François Maisonneuve
What do we mean by marginal gains?
We often hear about marginal gains, or the very small advantages equipment change can give to racers who are fighting for the few microseconds that make the difference in major victories. What exactly do we mean when we say marginal gains? How does a more aero frame relate to a lightweight one, for example?
Examples of potential marginal gains (for a 70kg rider exerting power of 300W, 0.25m2 CdA)
200g saved on bike: 20km, 7.5% gradient, no wind, Vr = 16.5km/h, ΔVr = 0.04km/h
à Gain = 10s over 1h12min
5% CdA improvement on bike: 20km, 0% gradient, no wind, Vr = 43.1km/h, ΔVr = 0.14km/h
à Gain = 5s over 30min
Of course, the ride quality and experience of being on the bike is a boost in itself – maybe much more than a marginal gain!
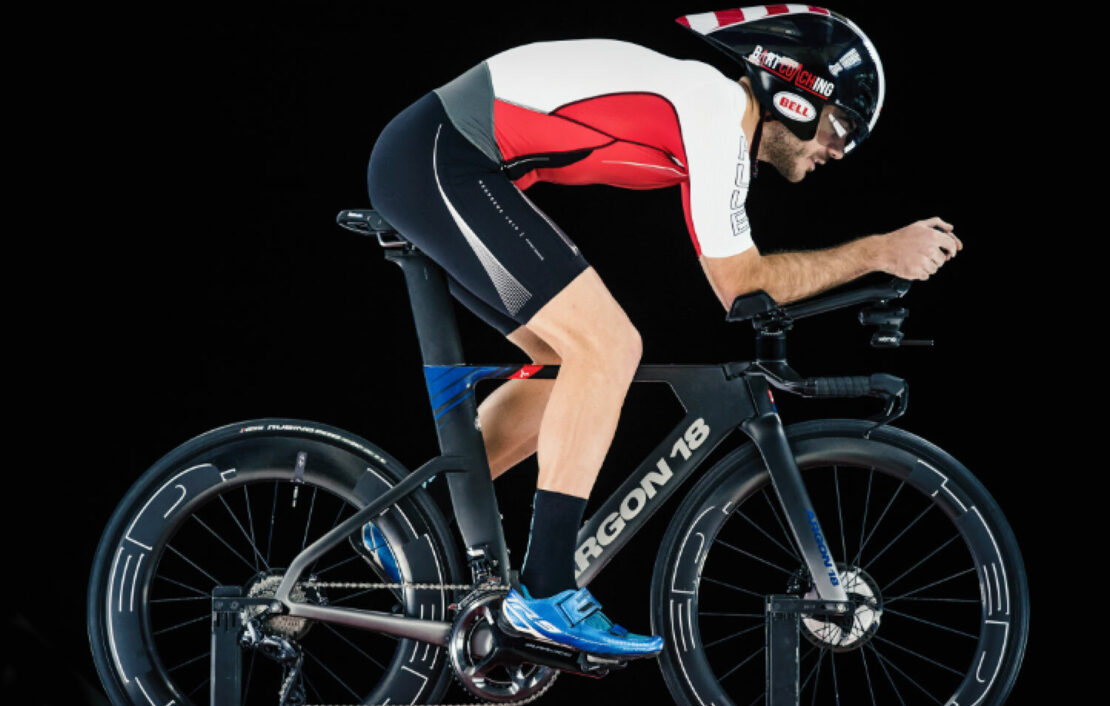 PHOTO: François Maisonneuve
The 80% Factor: Rider Positioning
If the bike only accounts for 20% of aero drag, that leaves 80% for the rider. Rider positioning is therefore highly important in the quest for drag reduction. When we go to the wind tunnel, we test our bikes, but also look at the effect of rider positioning. We then take these results into account in our geometry, cockpit design, and selection of components. As an example, let’s look at the potential gains of a 5% CdA improvement on both a bike and on the rider’s position.
Effect of aero on a flat Time Trial
20km, 0% gradient, no wind, Vr = 43.12km/h
5% CdA improvement on bike, ΔVr = 0,14km/h à Gain = 5s over 30min
5% CdA improvement on rider, ΔVr = 0,56km/h à Gain = 20s over 30min
How does aero testing affect our design process?
Aero performance is one of the key features of our bikes, and is repeatedly measured and evaluated throughout the development process. However, aero is not analysed alone, but always in conjunction with how new shapes affect stiffness and weight targets. All parameters are always evaluated simultaneously in a holistic approach. This approach is what guides our decisions. We evaluate initial design concepts across all parameters, so that we can be efficient in producing design iterations that move us closer to our performance goals. Once we have validated our design approach, we can move into the prototyping phase.